This month the operators who run the largest US power grid did the unglamorous thing: they forecast record demand for the July heat wave and staged their response before the temperature climbed. Emergency procedures, reserve capacity, demand-response contracts, all lined up in advance, because the one option grid operators never take is finding out how much load they can carry while the load is arriving.
Your product launch, on-sale, or Black Friday is the same event at web scale. A known spike, on a known date, against infrastructure whose real ceiling you can only guess at. And most teams still discover their p99 the same way a grid would discover its capacity by browning out: live, in front of everyone.
The surge is forecastable too, though. You can model it days ahead of the date, find the point where your infrastructure actually gives, and fix what you find while nobody is watching.
The average hides your slowest requests
The first mistake is watching the wrong number. A load test that reports "average response time: 240ms" under peak load sounds fine and tells you almost nothing. The average is dragged down by the fast majority of requests and quietly buries the slow tail — which is exactly the part that breaks during a spike.
Percentiles are where the truth lives. p50 is your median request. p95 means 95% of requests were at least this fast — and 5% were slower. p99 is the experience of your unluckiest one-in-a-hundred users, and at spike volume that's not a rounding error. If you serve 200,000 requests during a launch hour, p99 is the lived experience of two thousand people, often the ones with the fullest carts and the most items to render.
The tail also degrades non-linearly. A system humming along at p50 = 120ms can hold that median steady while p99 climbs from 400ms to eight seconds as concurrency rises, and through all of it the average barely twitches. Watch only the mean and the launch-day surprise finds you anyway. We wrote a fuller breakdown of why percentiles beat averages if you want the statistics behind it.
Model volume and experience separately
"Load" is two different questions wearing one word, and they need two different instruments.
The first question is raw volume: can the backend take the request count? That's protocol-level load: HTTP requests fired at your endpoints as fast as the test can generate them, no browser, no rendering. It's cheap to scale to tens of thousands of virtual users because each VU is just a request loop. This is how you find the point where your API tier, database connection pool, or queue backs up.
The second question is the one protocol tests can't answer: is the app still usable at that volume? A backend that returns 200s in 300ms can still ship a page that takes six seconds to become interactive because the client is doing real work: hydrating a SPA, running third-party scripts, rendering a heavy cart. That only shows up when a real browser executes the real page. Real-browser virtual users drive actual Chromium instances through the actual flow, so you measure what a human at the keyboard would feel, not just what the server emitted.
The practical pattern: start with protocol-level traffic to push volume and find where the backend bends, then run a smaller set of real-browser users against the same journeys to confirm the front end holds up under that pressure. TestVibe covers both from one place (Advanced mode generates the k6 script for protocol volume, Simple mode replays your generated Playwright features with real concurrent browsers), so modeling both ends of the surge doesn't mean adopting a second tool.
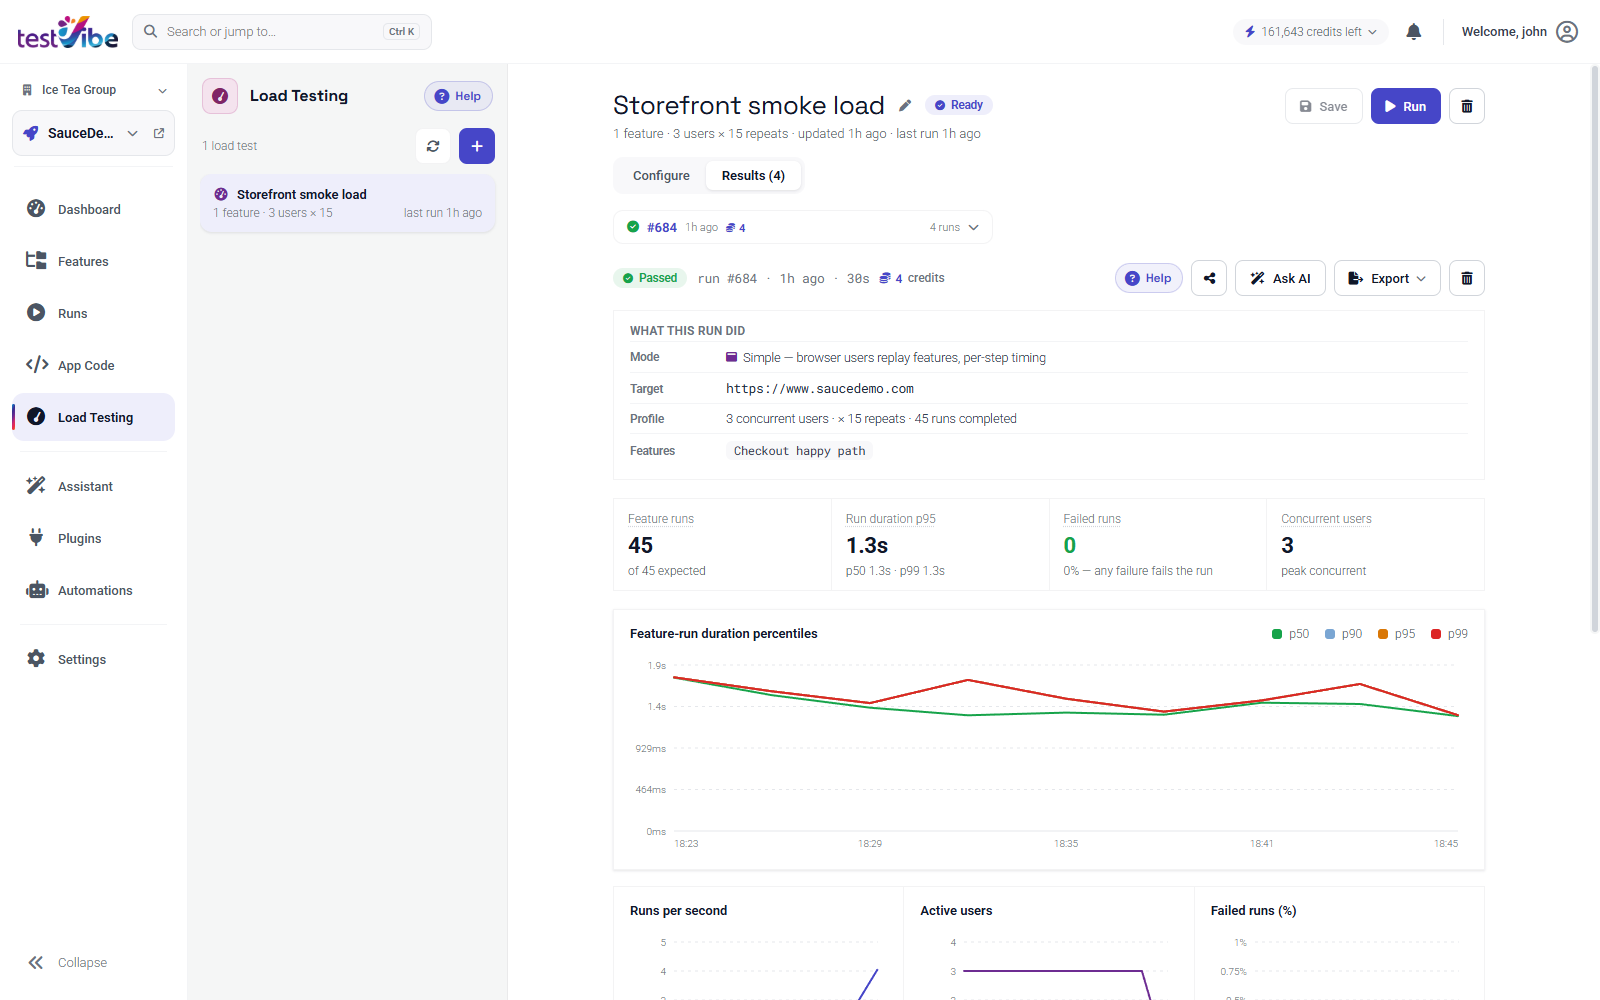
Find the knee
Every system has a knee, the concurrency level where latency stops rising gently and turns vertical. Below the knee, adding users costs you a few milliseconds each. Above it, each new user costs the whole system, because you've saturated some resource (CPU, connections, a lock, a downstream dependency) and requests start queuing behind each other.
You find the knee by ramping, not by hammering a single number. Start well under your expected peak and step the virtual-user count up in stages (say 100, 500, 1,000, 2,500, 5,000), holding each level long enough to get a stable percentile reading. Plot p95 and p99 against VU count. The knee is the inflection point where the line bends upward and refuses to come back down.
That number is the only honest answer to "can we handle launch." If your forecast peak is 3,000 concurrent users and the knee sits at 2,000, then your launch fails at 66% of expected traffic, and the saving grace is that you learned it on a Tuesday with time to fix it instead of at 9am on release morning.
Fix, then re-run
A single load test is a data point. The value is in the loop:
- Model the surge at and above forecast peak, ramping to find the knee.
- Read the percentiles — p95 and p99 under sustained peak, not the average, not a single burst.
- Locate the bottleneck. The load test tells you when it breaks; your traces, database metrics, and slow-query logs tell you why.
- Fix it — add a connection to the pool, cache the hot query, move the heavy render off the critical path, raise an instance count.
- Re-run the identical test and confirm the knee moved. Same script, same ramp, same percentiles, so the before/after comparison is real and not two differently-shaped tests.
Repeat until the knee sits comfortably above your forecast peak with headroom, because forecasts are wrong and heat waves run hotter than modeled. The load testing walkthrough covers the mechanics of configuring a ramp and reading the output end to end.
One more thing the grid does that web teams often skip: they keep watching after the event starts. A load test proves the ceiling exists on the day you ran it. Production drifts: a dependency slows, a dataset grows, a deploy adds 200ms. Pair your pre-spike load test with continuous monitoring so the ceiling you validated is the ceiling you still have when the spike actually lands.
The grid never lets the heat wave tell it where the ceiling is. Your launch doesn't have to either. Run the ramp this week, read p95 and p99, push the knee above your forecast with headroom to spare, and on-sale morning turns into a number you already checked rather than one you're about to find out the hard way.
Want to model your next spike before it arrives, protocol-level volume and real-browser checks, with latency percentiles you can actually read? Get early access, or read the load testing walkthrough to see the full flow.