Most teams treat monitoring and testing as separate disciplines with separate owners. They shouldn't, because both are answering the same question from opposite ends of a release: does the app actually behave the way we think it does? Tests ask before you ship. Telemetry answers after, once real users have had their way with it. Wire the two together so each feeds the other, and "we got paged again" starts turning into "that can't happen twice."
Two ends of one feedback loop
A test and a telemetry alert are both checking behavior against expectations; they just run at different times, against different inputs. The gap between those inputs is where bugs live. Your tests run against the cases you thought of, in a clean environment, at a concurrency of one, while production runs against the cases you didn't think of, with real data, real load, and the real network weather of a Tuesday afternoon. No test suite closes that gap by itself. Telemetry shows you where it is, and a test is how you seal it.
What telemetry catches that tests miss
Point the TestVibe telemetry agent at your app and Dashboard → Telemetry streams live CPU, memory, active sessions, thread count, and GC heap from the servers actually serving traffic. It streams only while you watch, so there is no idle traffic, and it stays best-effort so it can never disturb the app it's measuring.
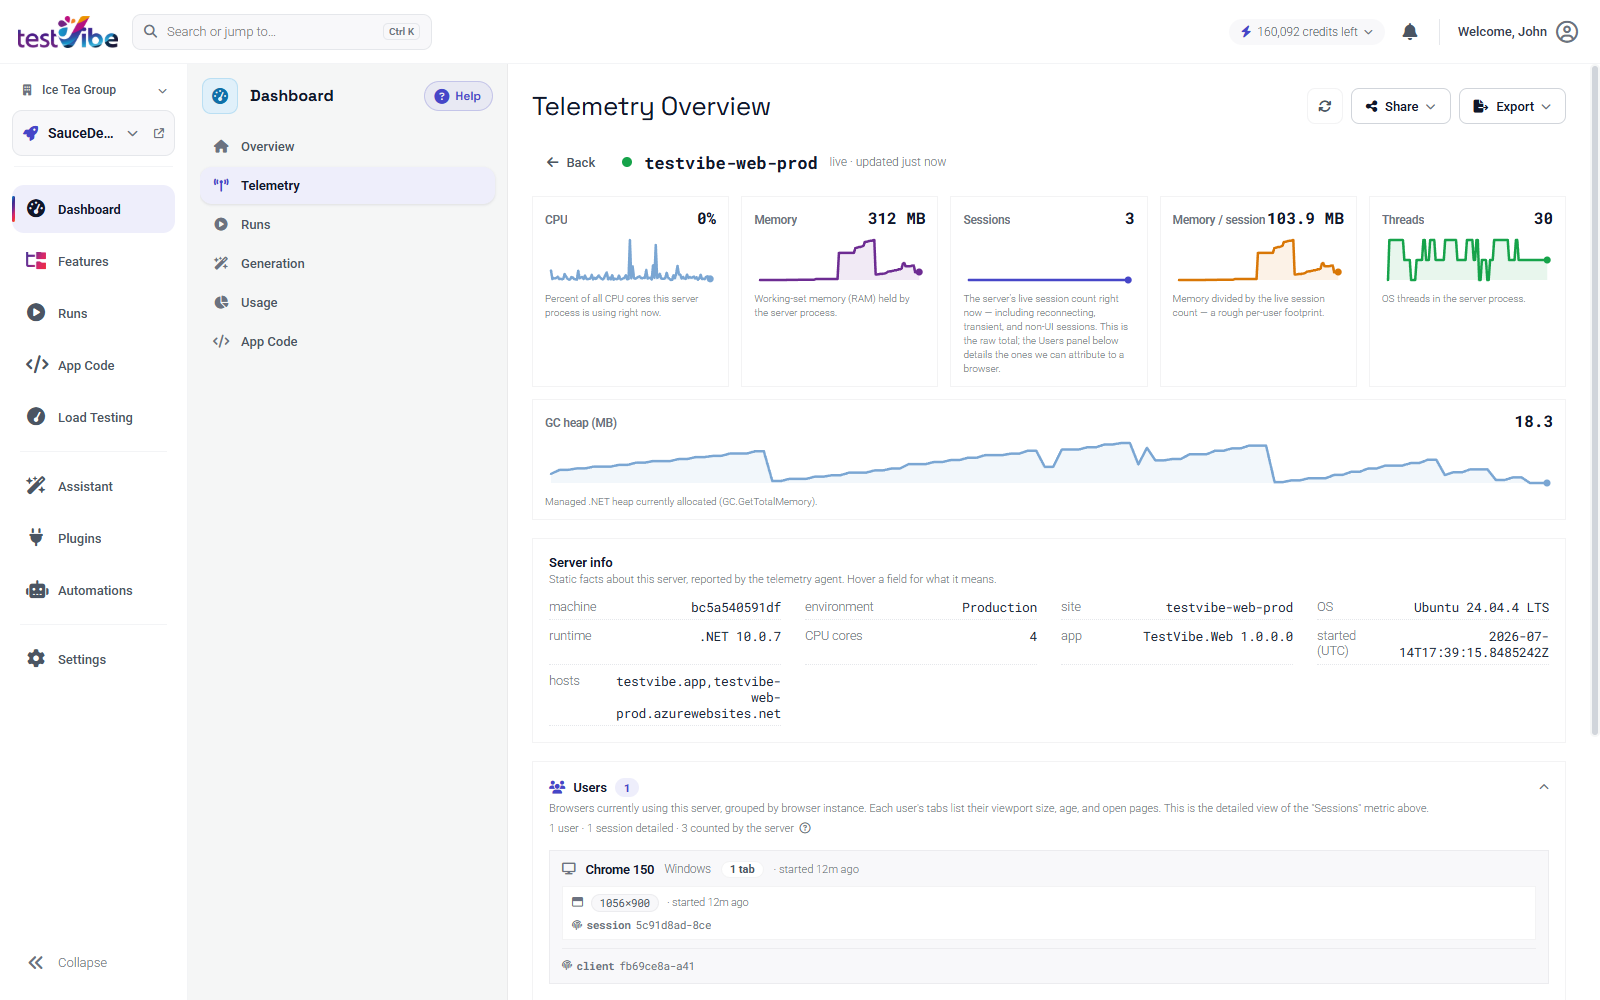
This is the part your suite structurally cannot see:
- Memory that climbs run-over-run and never recovers is a leak your load test is exposing under sustained concurrency, and a single-request unit test will never see it.
- CPU saturating while p95 latency rises is a capacity ceiling, and no assertion in your suite is written to express it. The chart is where it shows up.
- Sessions confirms the concurrency you configured actually materialized.
And then there are errors. The agent captures unhandled exceptions automatically, and you can report handled ones too. TestVibe fingerprints them and rolls them up under Dashboard → Telemetry → Errors & exceptions, so ten thousand crashes from one code path become a single group with a count:
try
{
    CheckoutService.Submit(order);
}
catch (Exception ex)
{
    // Grouped + persisted under Dashboard → Telemetry → Errors & exceptions.
    TestVibe.Telemetry.ReportError(ex);
    throw;
}
That group is a real bug, from real usage, with a real stack trace. Your users found the repro and filed it for you, whether they meant to or not.
What tests prevent that telemetry found
The two sides of the loop don't do the same job, and that asymmetry is the whole reason to connect them. Telemetry can only report that a bug happened. Preventing it from happening again is a test's job, not a dashboard's.
Monitoring on its own puts you on a treadmill. You get paged, you patch, you deploy, and nothing stops the same class of bug from wandering back three sprints later when someone refactors the checkout path. The error group goes quiet and then returns with a fresh date on it. You've watched the problem happen over and over without ever pinning it down.
Pinning it down is what a test is for. Once you've reproduced the crash telemetry flagged, you encode that reproduction as an assertion and drop it into the suite, and now the bug has a tripwire: the next time someone touches that path, the test fails in CI instead of on a customer.
Closing the loop: error to test
Closing the loop looks like this:
- Telemetry surfaces a bug. An error group spikes — say, a 500 when someone clicks Place order with an empty cart.
- Reproduce it as a test. Describe the behavior in plain language; TestVibe generates a Playwright test and verifies it by actually running it in a cloud sandbox before handing it back. What you get is honest — it either reproduced the path or it didn't.
- Add it to the suite. The reproduction becomes a permanent guard:
import { test, expect } from '@playwright/test';

// Reproduces the checkout crash telemetry flagged:
// empty cart + "Place order" returned a 500 instead of a validation message.
test('placing an order with an empty cart is a validation error, not a crash', async ({ page }) => {
  await page.goto('/cart');
  await expect(page.getByTestId('cart-items')).toBeEmpty();

  await page.getByRole('button', { name: 'Place order' }).click();

  await expect(page.getByRole('alert')).toHaveText(/your cart is empty/i);
});
When the failure came from a test run rather than production, the loop is even tighter: open Debug with AI on the failed result and the trace viewer opens with a docked assistant that reads the trace, diagnoses the failure, and can either fix the test or open a pull request against your source, so the diagnosis and the fix stay next to the evidence instead of getting handed to a ticket that someone reads three days later.
Make the loop turn on its own
A loop you have to remember to run will eventually stop running. Automations take that out of your hands: schedule a full-suite regression at a quiet hour on a cron trigger, or chain one so the regression suite fires automatically when a smoke run passes. Every regression test you added from a telemetry finding then runs unattended, every night, for as long as the project lives.
The two ends can even meet in real time. Open Dashboard → Telemetry while a load test replays your features and you'll watch CPU, memory, and sessions react to synthetic traffic before a single real user generates any. Testing and monitoring, same screen, same moment.
The takeaway
Run monitoring without tests and you keep rediscovering the same bugs. Run tests without monitoring and you're guessing which behavior actually matters once real traffic hits it. Put them together and each one covers the other's blind spot: telemetry points at the bugs that are really happening, the tests you write from those findings keep them from coming back, and automations keep the cycle turning while you go work on something else.
Want to close the loop on your own app? Get early access, or read the telemetry guide to see what your telemetry is already trying to tell you.