July 2026 has been a bad month to run a website. On July 2, an Arelion backbone incident rippled through Tier-1 transit while CircleCI's web experience and pipelines degraded on the same day. GitHub Actions runners queued and stalled on July 9. Cloudflare has thrown intermittent 5xx wobbles across the stretch. If you keep an eye on the public internet-outage timelines, the pattern is obvious: the substrate everyone builds on is shaking more than usual.
When that happens, your Slack fills with the same message from three different directions: is the site down? And the honest answer, in the first minute, is almost always I don't know. The outage itself you can handle. What burns the first hour is not knowing whether the outage is even yours to fix.
The question you actually need answered
"Is the internet having a day" and "we shipped a bug" produce identical symptoms from where you sit: error-rate spikes, support tickets, a graph trending the wrong way. But they demand opposite responses. If the internet is the problem, you communicate, wait, and maybe fail over, because rolling back your own perfectly good deploy only makes things worse. If you are the problem, every minute you spend blaming Cloudflare is a minute your checkout stays broken for real customers.
So "is something wrong?" is the question you can already answer. Something is. The one worth spending your first minutes on is much narrower:
Right now, is one of my critical flows actually broken for the people using it, when I check from outside my own infrastructure?
Answer that in minutes and the outage becomes a manageable incident. Fail to answer it and you spend an hour in a war room arguing about a dependency you don't control.
Two signals, and why you need both
There are exactly two instruments that answer the question, and each one lies if you use it alone.
Synthetic runs drive your real flows from outside your own network: a browser that loads your homepage, logs in, adds to cart, and checks out, on a schedule, from infrastructure that isn't yours. When a synthetic run of checkout goes red you don't have a graph to interpret, you have a specific, reproducible statement: the purchase path failed, here's the step, here's the screenshot and the trace. It can't tell you why revenue dipped, but it can tell you, without ambiguity, whether the flow that produces revenue still works.
Production telemetry watches the servers actually running your app under real traffic: CPU, memory, active sessions, and the unhandled exceptions your app is throwing right now, not a synthetic replay. This is the ground truth of impact, real requests on real infrastructure under real load. It is also noisy and correlational. A memory climb or an error spike could be your bug, a dependency behaving badly, or a traffic pattern nobody load-tested.
Put them side by side and the ambiguity collapses:
| Synthetic (your flow, outside) | Telemetry (your servers, real traffic) | Verdict |
|---|---|---|
| Green | Error spike | Probably upstream/CDN, or a subset of users/regions. Communicate, don't roll back. |
| Red | Error spike | It's you. The flow is broken and users are hitting it. Roll back / fix now. |
| Red | Quiet | You broke it, but low traffic or a path few users hit yet. Fix before it spreads. |
| Green | Quiet | Noise. Stand down. |
That two-by-two is the entire diagnostic. Everything below is just how to wire it so the answer is waiting for you when the pager goes off, instead of something you scramble to assemble at 2am.
Wire it before you need it
The failure mode here is trying to build the instrument during the fire. You can't stand up synthetic monitoring while checkout is down and expect a calm read. The whole point is that it's already running.
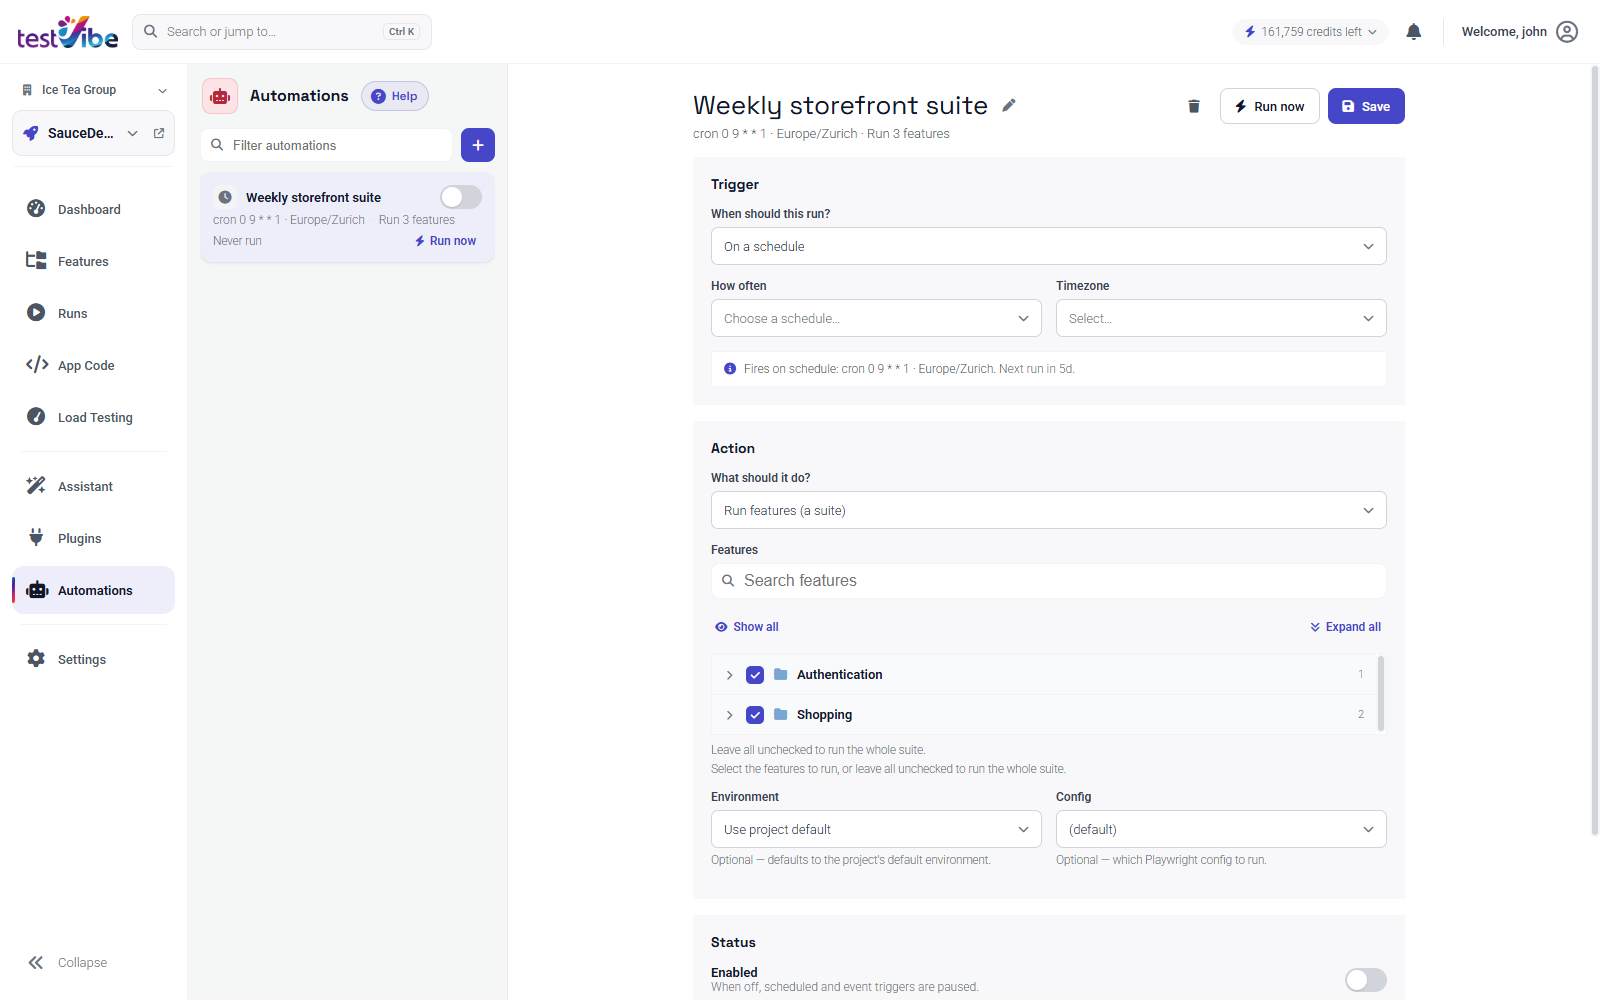
Turn your critical flows into scheduled synthetic runs. Take the three or four journeys that, if broken, mean you're losing money or trust (sign-in, checkout, the core create action) and run them on a schedule against production. Not the whole suite; the load-bearing few. In TestVibe these are just automations: pick the features, set a cadence (every 15 minutes for the ones that matter most), and each firing is a real browser executing the real flow against your real URL. When one goes red, you get the failing step plus the artifacts: the screenshot at the moment of failure, the video, the full Playwright trace. "Checkout is broken" now arrives as evidence instead of a hunch.
Keep production telemetry on the same pane. Synthetic runs prove the flow works from outside; telemetry proves whether the app underneath is actually hurting. Streaming CPU, memory, active sessions, and exception history straight from the running app means that when a synthetic run stays green but the graph looks ugly, you can see whether your servers are erroring under load, and if they are, whether your own code or a dependency shows up in the stack trace.
That combination is what separates monitoring your servers from monitoring your product. Your servers can sit at a comfortable green while checkout is quietly broken for every single person trying to pay you, and a wall of healthy infrastructure metrics will cheerfully report that nothing is wrong.
The triage flow, concretely
Here's the runbook. The pager fires, or someone asks "is the site down?" Instead of guessing:
- Look at the last synthetic run of your critical flows. Not the infra dashboard — the run that drives checkout end to end. Green in the last 15 minutes? Your load-bearing path works from outside your walls. Red? You have a confirmed, reproducible break with a trace attached. Start here every time.
- Cross-check telemetry for real impact. Is your production app throwing errors right now, and if so, is your code in the stack or a dependency? A spike confined to one third-party call is a different incident than an unhandled exception spreading across the app.
- Read the verdict off the two-by-two. Green + noisy telemetry → likely upstream; communicate and hold, don't panic-roll-back a good deploy. Red + errors → it's you; ship the fix or revert. Red + quiet → you broke it before traffic noticed; move fast.
- When it's you, go straight to the artifacts. A failed synthetic run hands you a scenario rather than a number: re-run and triage it with the trace open, stepping through the exact DOM state at the moment it broke. You're debugging a real signal instead of reconstructing one from log fragments.
Notice what this removes: the argument. Nobody's litigating whose fault it is from vibes, because the synthetic run already settled it. The team spends its minutes writing the fix instead of debating what the dashboards mean.
The backbone, the CI provider, the CDN: all of it will keep having bad days on a schedule you don't set. What you actually control is how many minutes pass before you know whether their bad day has become yours. Wire both signals up now, while everything's green, and the next time the substrate shakes you'll be reading one red-or-green run instead of assembling a war room from scratch.
Want scheduled synthetic runs of your critical flows, with production telemetry on the same screen? Get early access, or read how automations turn a feature into a monitor.