You have two dashboards that both look great, and between them they still miss the thing you actually care about. The first is your Core Web Vitals report: INP green, LCP green, measured by a synthetic probe that hits your homepage every few minutes from a quiet data center. The second is your last load test, where the API held 5,000 requests per second with p95 under a second. Both numbers are real. Neither of them tells you what a person experiences when the traffic actually arrives.
Launch days go wrong in the gap between "the server responded fast" and "the app felt fast." That gap sits between performance monitoring and load testing, and almost nothing you already run is pointed at it.
Two green dashboards, one missing question
Field vitals and synthetic vitals both measure your app when it isn't under stress. Real User Monitoring aggregates over a population that's mostly browsing on a normal Tuesday, and synthetic probes fire from an idle machine against an idle server. Your INP score, the metric that replaced First Input Delay as a Core Web Vital in March 2024, is computed from those calm conditions. Google's "good" bar is an INP at or below 200 milliseconds, and hitting it at 3 a.m. is not hard.
INP measures the latency of an interaction: you click, and it counts how long until the page visibly responds. It matters here because it is a main-thread metric, and it degrades precisely when the browser's event loop is busy running JavaScript, working through a queued re-render, doing real work. At 3 a.m. the event loop is empty and every click is instant. During the rush the same click lands behind a queue of other work, and the spinner spins while a real person waits. Your monitoring never saw it, because your monitoring wasn't there when it was busy.
The load test has the opposite blind spot. Protocol-level load, raw HTTP requests fired at your endpoints, is the right tool for one question: can the backend take the volume? It is cheap enough to reach the concurrency that actually breaks an API tier or saturates a connection pool, and it isolates server latency from everything else. But a protocol VU has no DOM, runs no JavaScript, and renders nothing, so it can report 200s in 300 milliseconds while the page those responses feed takes six seconds to become interactive. Your backend looks perfectly healthy in that test, and the customer has already closed the tab.
So you have one instrument that measures experience but only when idle, and another that measures load but only at the server. The question that falls through the crack is the one that actually matters on launch day: is the app still usable when it's busy?
The instrument that answers it
To measure experienced latency under load, you need something that is both a real browser and a concurrent user. That is a browser virtual user: an actual headless Chromium instance, driven through a real user journey, running alongside hundreds of other requests hammering the same backend. It renders the page, runs your bundle, and fires the same XHR waterfall a human would trigger. Then it times the thing a human actually feels, which is the gap between clicking checkout and seeing the confirmation.
These two kinds of virtual user do different jobs, and picking the wrong one either wastes money or measures the wrong thing. Protocol VUs generate volume cheaply, but they are blind to the browser. Browser VUs cost more per user and, in exchange, see everything the browser does. We wrote a fuller comparison in browser VUs vs protocol VUs; the short version is that protocol traffic creates the stress and browser traffic tells you whether a real person would notice it.
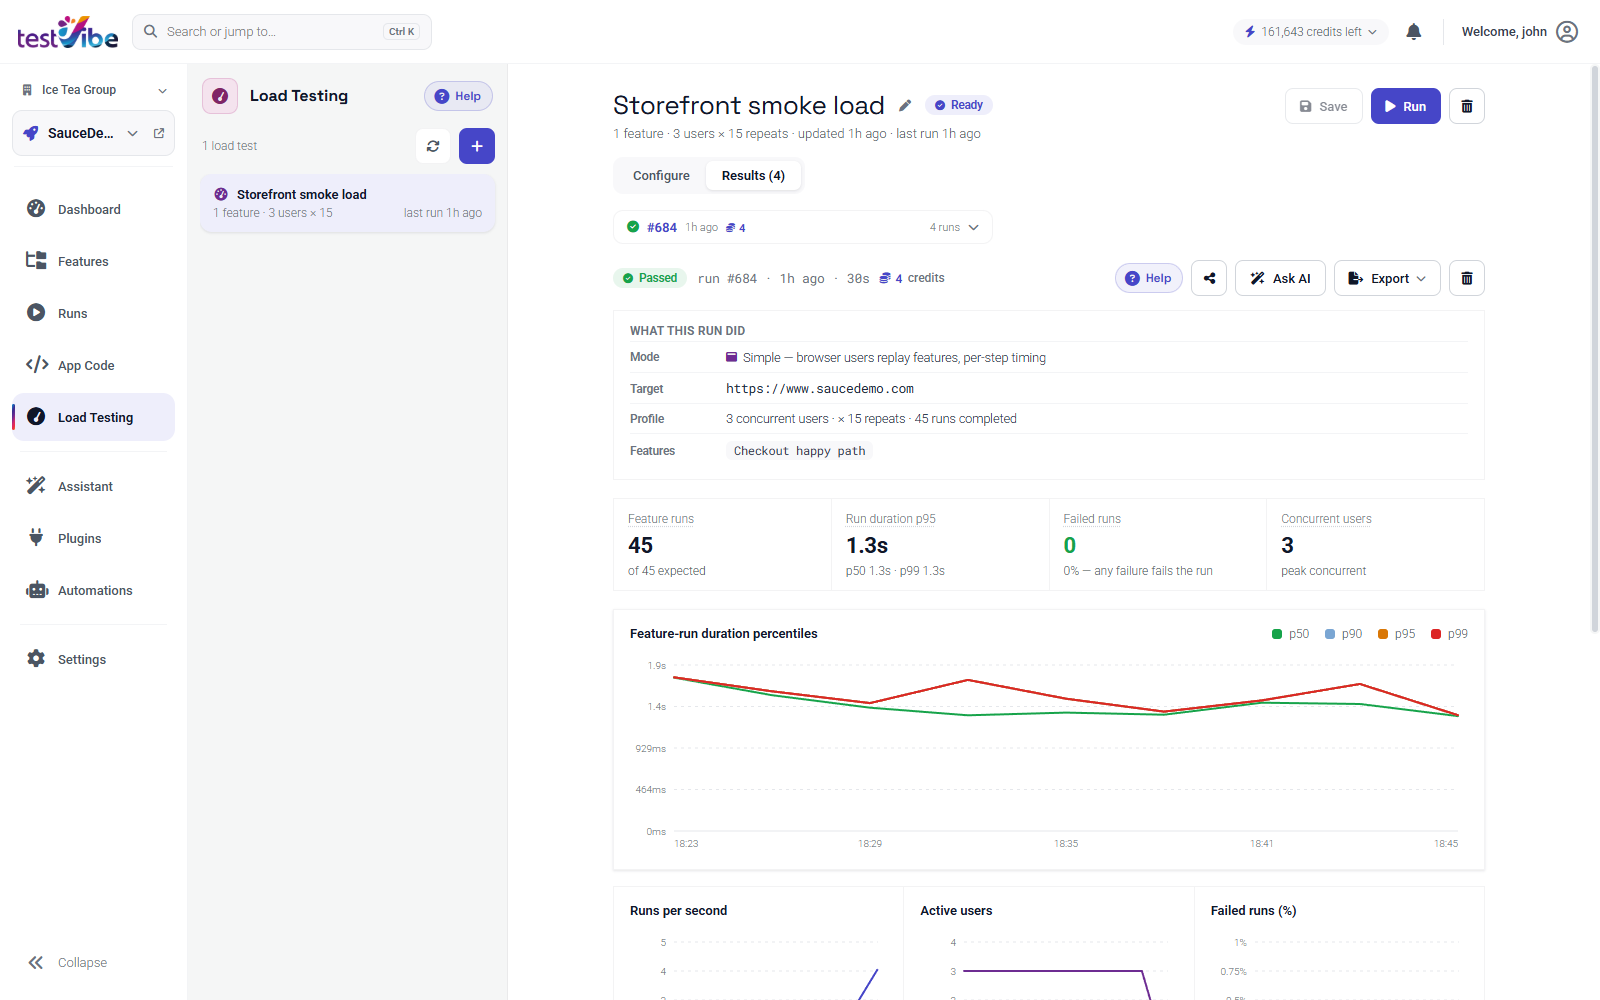
The pattern that works layers them. Use protocol VUs to push the background load, the thousands of concurrent requests that drive your infrastructure toward its ceiling. Then run a smaller pool of browser VUs replaying your real feature journeys while that pressure is on. The protocol load saturates the event loop and the connection pool and the render queue, and the browser VUs measure the "click to confirmation" latency while it is saturated. That number, experienced latency under concurrency, is the one your calm INP score can't produce and your protocol test can't see.
The p95 user is the one tweeting about you
Once you're measuring experienced latency, resist the pull toward the average. "Average interaction: 240 ms under peak load" sounds fine and buries the exact users who churn, because the mean is dragged down by the fast majority and quietly hides the slow tail.
Percentiles are what carry the experience. p50 is your typical user. p95 means one in twenty interactions was at least this slow, and at spike volume one in twenty is a lot of people. p99 is your unluckiest one-in-a-hundred, and across a launch hour that is thousands of humans, often the ones with the fullest carts and the heaviest pages to render. The tail also degrades non-linearly: a system holding p50 steady at 120 ms can watch p99 climb from 400 ms to eight seconds as concurrency rises while the average barely twitches, so if you only watch the mean you get the launch-day surprise anyway. The statistics behind reading percentiles are the same whether you're measuring server latency or experienced latency. The difference is that browser VUs let you compute those percentiles on the number a user actually feels, per step of the journey, so you can see which interaction degrades first.
That is what matters most for input-heavy pages. INP dies under load on exactly the surfaces that do the most client-side work: a search-as-you-type field, a cart that re-renders on every quantity change, a dashboard rehydrating a SPA. A protocol test never touches that code. A browser VU runs it at concurrency and hands you the p95 of the interaction, which is the honest version of the INP score your monitoring reported green.
Where this sits next to your monitoring
None of this replaces monitoring; it complements it. Synthetic and field vitals tell you how the app behaves at rest, and you should keep watching them. Pair a pre-spike load test with continuous production monitoring so the ceiling you validated stays the ceiling you actually have. Just don't mistake a green resting score for a result, because every app is fast when nobody is using it.
So measure the busy case before it's live, the same way you'd model a surge before the spike arrives instead of discovering your capacity by browning out in front of everyone. Ramp protocol traffic until you find where the backend bends, layer browser VUs on top to read experienced latency under that pressure, and watch the p95 and p99 of the interaction rather than the average of the request. The concurrency level where the tail fans out and the spinner starts spinning, not your 3 a.m. INP, is the honest answer to whether you can handle the rush.
You only find that number by generating the traffic yourself and timing a real interaction through a real browser while the load runs, well before the real users show up.
Try it before the rush
Want to measure experienced latency under load, with real browsers replaying your real journeys as concurrent users and per-step percentiles instead of a comforting average? Get early access, or read the browser-VU breakdown to see how the two kinds of virtual user fit together.